Debug, Optimize and Monitor Your Memcache With the MemCachier Advanced Analytics Dashboard
 Paddy
~ February 1, 2023
Paddy
~ February 1, 2023
Debugging a Memcached cache can be challenging. A cache often seems like a black box, cumbersome to view its contents and complicated to evaluate its performance. MemCachier’s advanced analytics tools enable you to troubleshoot, optimize and monitor your memcache so you can cache effectively with confidence.
Advanced Memcached debug tools
Our advanced Introspection features (Prefixes, Keys and Recent Requests) are available starting with our Advanced plans (1 GB+).
Memcached optimization with Prefixes
Prefixes is the most powerful feature on the MemCachier dashboard. Watching prefixes enables you to analyze the performance of different parts of your caching strategy.
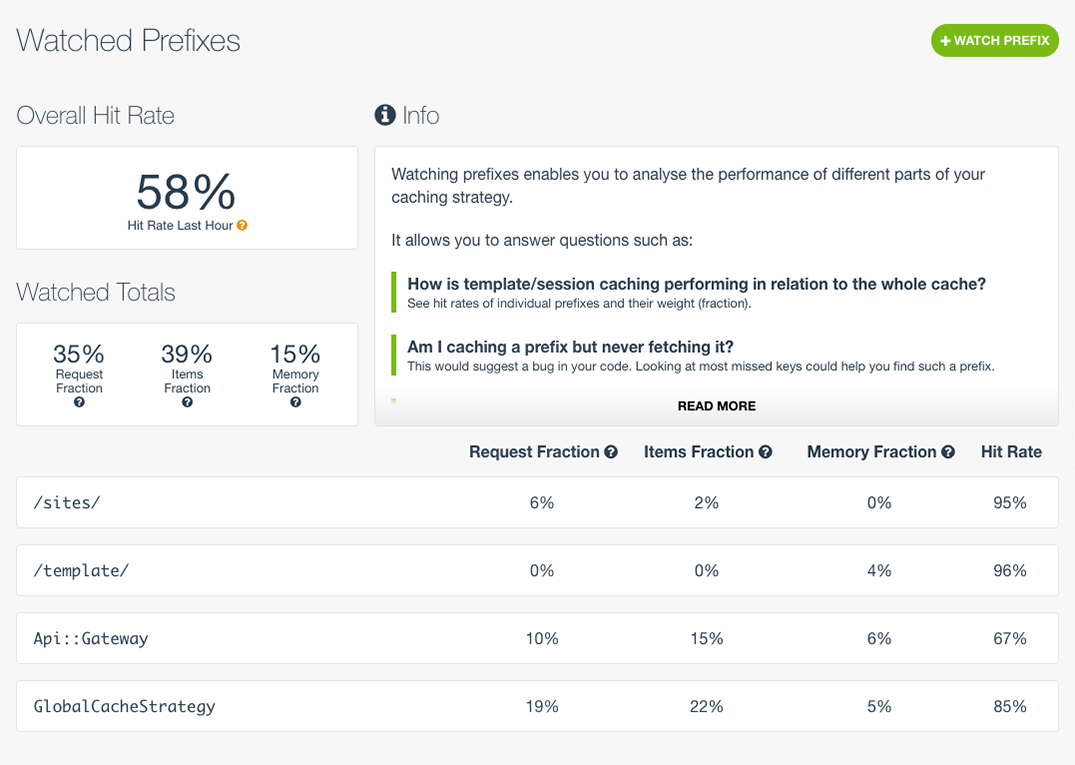
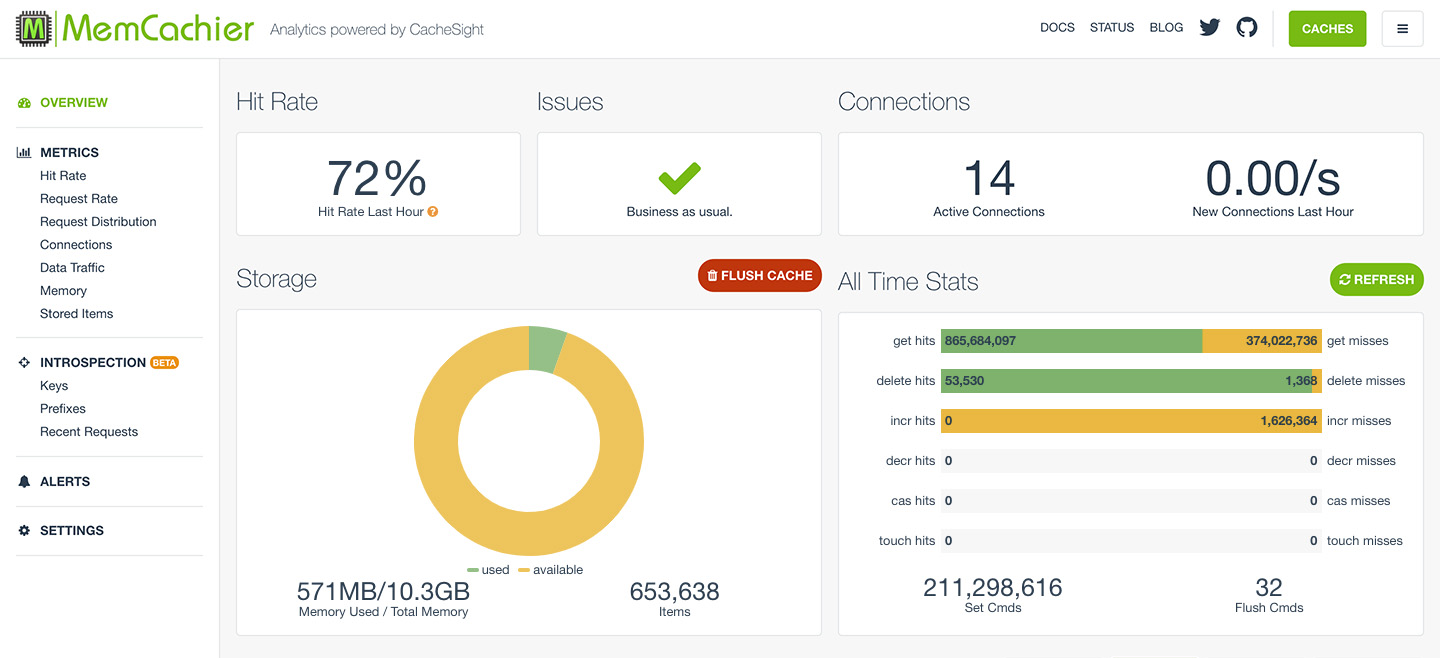
When we created our first analytics dashboard we put performance front and center by highlighting the overall cache hit rate, or hit ratio, over time. Hit rate being the most important metric when evaluating the performance of a cache. Now, with prefix stats you can drill deeper into the performance of your cache by analyzing the the hit rate for specific aspects of your caching strategy.
To start seeing prefix stats you first need to watch a prefix. To give you some suggestions for what prefixes to watch, we show you the prefixes that were most active recently. Watching a prefix will start the data gathering process and after a while you should see the hit rate for keys with this prefix as well as the weight the prefix has, i.e., the fraction of items and memory it is currently consuming.
Pro tip: we only suggest the recently most active prefixes to watch. However, less active prefixes might also be interesting. For example, looking at the Most Missed Keys on the Keys view might hint at a prefix that, while less active, highlights a bug in your caching implementation.
Clicking on a watched prefix will reveal more details and historical data. You can see how the hit rate, weight, and activity has changed over time. This view also allows you to see stats for the most active keys in this prefix. Last but not least, we also suggest some frequently used sub-prefixes you could add to your watch list.
All in all, watching prefixes can reveal important aspects about your caching strategy. First and foremost it highlights the performance of individual aspects of your cache, for example, by showing you how template or session caching is performing in relation to the rest of the cache. It could show you a part of your cache that might benefit from preemptive caching. It also has the potential to show you bugs, for example, by showing a prefix you cache but never fetch. Finally, you might also discover prefixes that are not worth caching, i.e., a prefix that uses a large memory but small items fraction and has a low hit rate.
Hot Keys
Keys gives you insight into the most popular keys overall in your cache and how they are performing. This view shows you the most hit, missed, and mutated keys in the last few minutes.
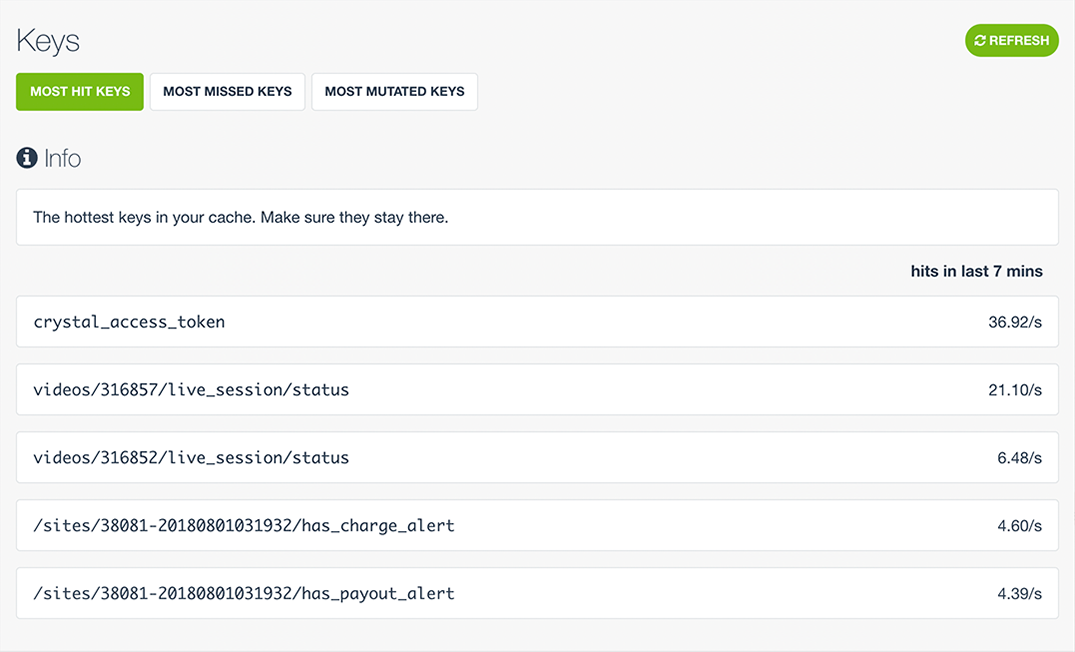
Most hit keys
This view shows the hottest keys in your cache. That basically show you where you are doing a good job at caching and what cached items are important in your application.
Most missed keys
Most missed keys in many cases is the most valuable of the three Keys views.
When caching, it is common practice to store a value after it has been missed, so in a well implemented caching strategy, keys should never be missed frequently. If a key is missed more than once it means that it was either evicted or not stored. Within a few minutes, if a key is missed, stored, evicted, and then missed again it probably means your cache is not large enough. If your key is missed very frequently you are probably not storing it. This means you likely have a bug in your code and need to figure out why the key is not being stored.
Most mutated keys
While certain values are expected to change frequently, such as counters, sometimes the most mutated keys can show an apparent bug. For example, if a key is obviously not a counter, or has no reason to change frequently, this key is probably being continuously stored without any need for it. Finding and removing unused storage requests will conserve your bandwidth and speed up your application.
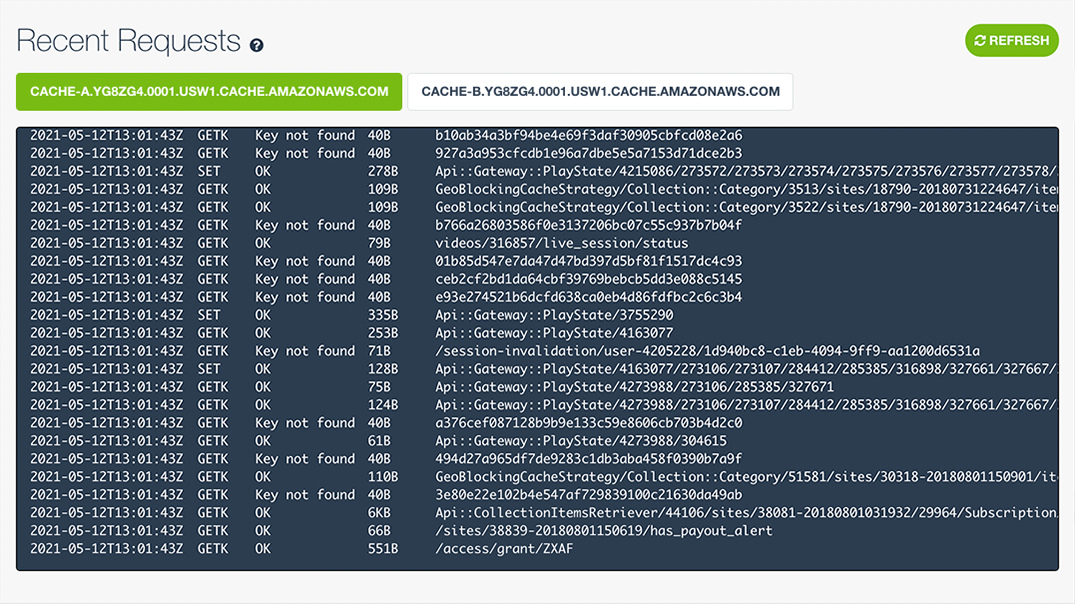
Memcached troubleshooting with Recent Requests
Recent Requests displays the last 100 requests per server from your cache’s logs. It is useful for quick troubleshooting and making sure your cache is working as expected.
Memcached monitoring
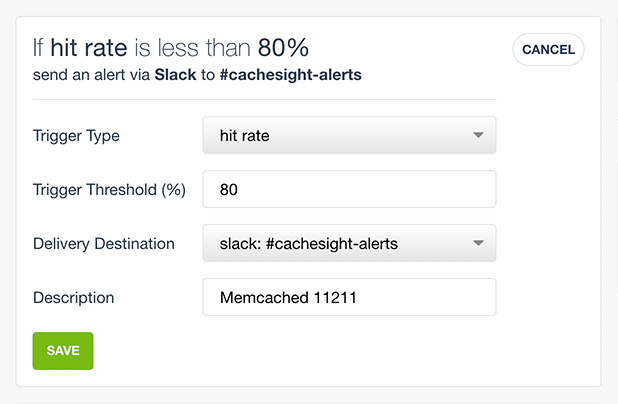
Our Alerts feature is available starting with our Basic plans (100 MB+).
Alerts can be created for hit rate or memory usage and can be delivered by email or Slack. Alerts are useful for quickly being notified of unexpected changes in your cache’s performance.
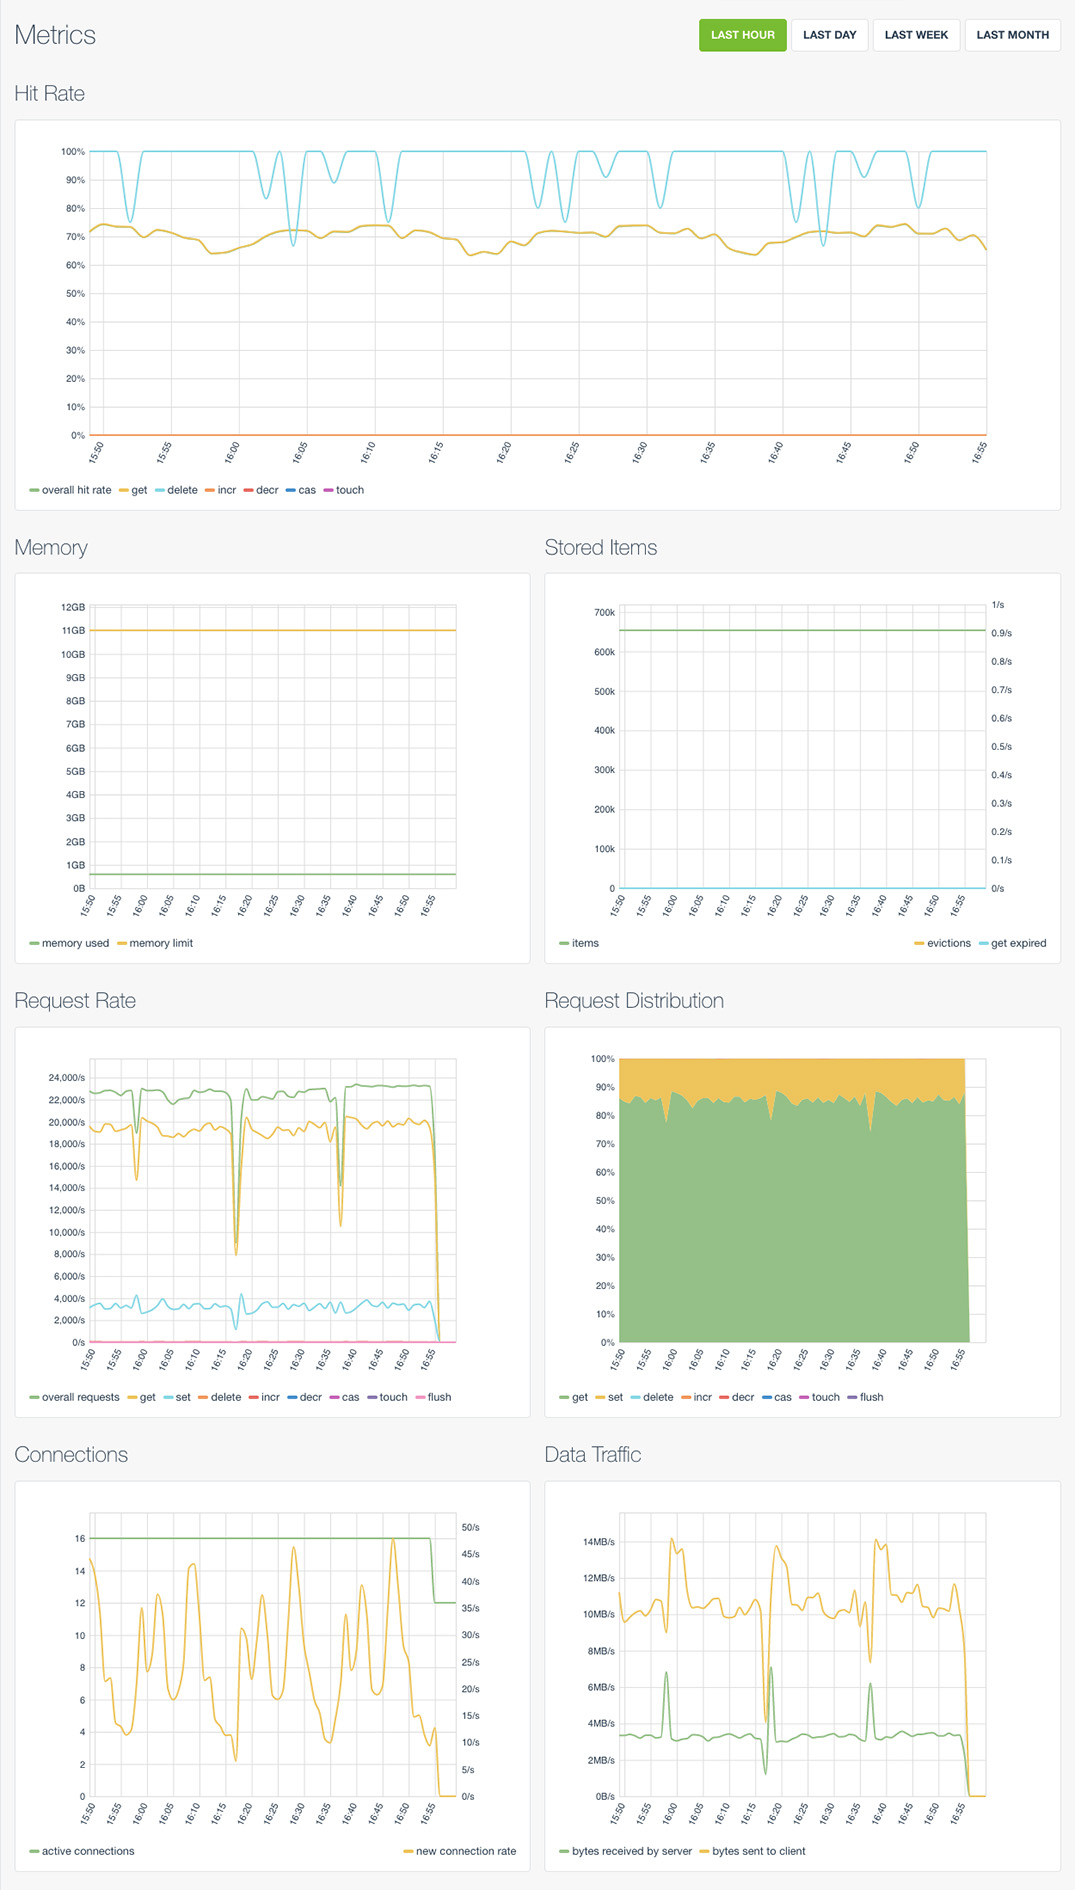
Metrics
Our Metrics feature is available on all plans, including free Developer plans. It includes graphs for hit rate, memory, stored items, request rate, request distribution, connections and data traffic. Hit rate is front and center, being the most important metric for assessing the performance of a cache.